


Dark-Cloud-Cover-Pattern-1
Dark Cloud Cover Candle Pattern: What Every Trader Should Know
Have you ever wondered how traders predict when a market might suddenly change direction? One of the key signals they watch for is called the dark cloud cover candle pattern. It might sound mysterious, but it’s actually a simple yet powerful signal that can warn about potential drops in stock prices. Whether you’re someone curious about trading or considering enrolling in trading courses, understanding the dark cloud cover candlestick pattern is a great place to start.
Let’s dive into what this pattern really means, why traders pay attention to it, and how you can spot it yourself.
Learn about the dark cloud cover candle pattern, a key bearish reversal signal. Understand its meaning, spotting tips, and role in trading courses.
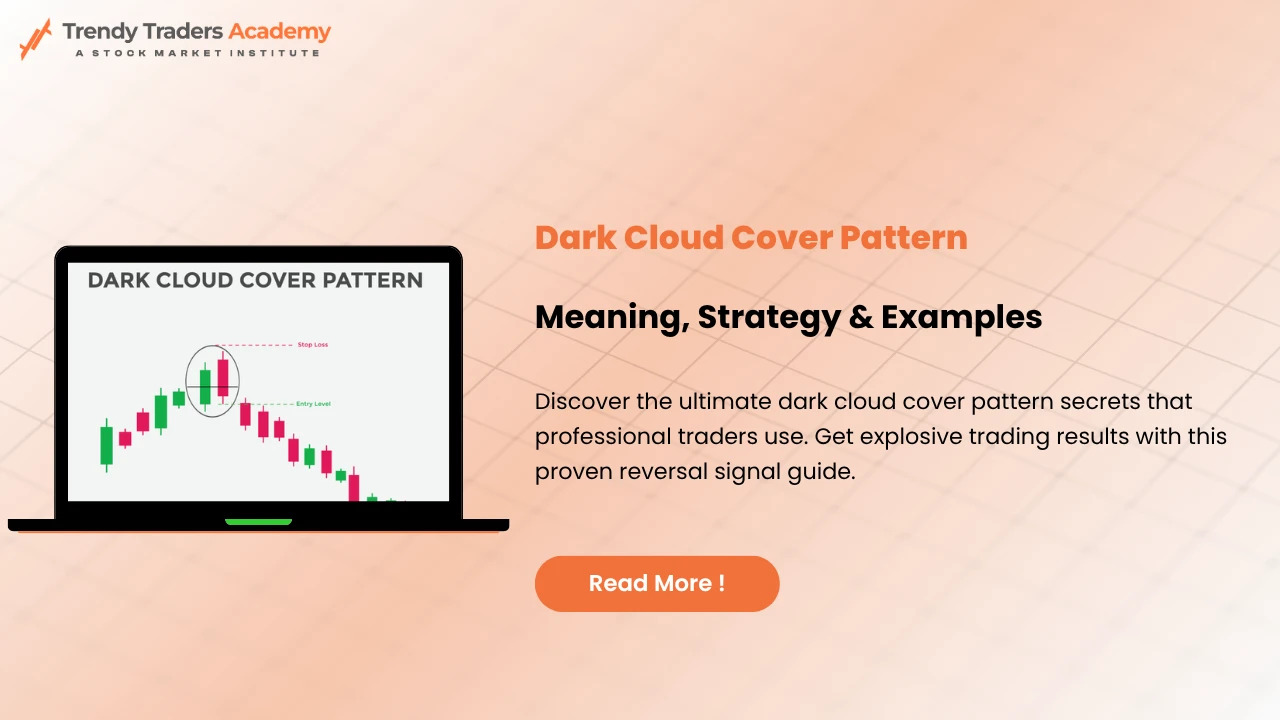
What Is the Dark Cloud Cover Pattern?
Imagine a sunny day suddenly clouded by dark clouds—that sudden shadow signals a storm might be coming. In trading, the dark cloud cover pattern works similarly: it’s a two-candle pattern on a stock chart that suggests a shift from optimism (prices going up) to pessimism (potential price drop).
This pattern forms after an upward movement in price and signals that the bullish momentum could be weakening, with sellers starting to take control.
The Anatomy of the Dark Cloud Cover Candle
The pattern consists of two specific candlesticks:
- First candle: A strong, bullish candle with the price closing near its high, showing buyer confidence.
- Second candle: A bearish candle that opens above the previous candle’s close but then closes below its midpoint, suggesting a shift in control to sellers.
This ‘cover’ of the previous candle by the second bearish one is why the pattern gets its name.
Why Is It Called “Dark Cloud Cover”?
The name paints a vivid picture—the first candle represents a sunny sky (the bullish move), while the second candle, the ‘dark cloud,’ opens higher but then pushes prices down sharply, overshadowing the first candle’s optimism. This metaphor helps traders remember and quickly identify the pattern.
How the Pattern Indicates a Trend Reversal
Why does this pattern matter? Because it signals a potential change from an uptrend to a downtrend. That means buyers’ strength is fading, and sellers are beginning to dominate, which could mean prices will start falling. Traders see the dark cloud cover as an early warning to reconsider their bullish positions.
Key Characteristics of the Pattern
To spot a valid dark cloud cover pattern, look for:
- The pattern must appear after a clear uptrend.
- The first candle is bullish (usually green or white).
- The second candle gaps above the first candle’s close on the open.
- The second candle closes below the midpoint of the first candle’s real body.
- The second candle is bearish (usually red or black).
These features help confirm the pattern’s reliability.
How to Identify the Pattern on Charts
When looking at candlestick charts, the pattern stands out because the second candle opens above the previous close (gap up) but ends the session by closing well into the first candle’s body — specifically below its midpoint. This sudden reversal in sentiment makes the pattern especially noticeable.
Dark Cloud Cover vs. Other Candlestick Patterns
How does this pattern differ from others? For example:
- Piercing Pattern: The bullish counterpart where the second candle closes above the midpoint of the first candle in a downtrend.
- Engulfing Pattern: Where the second candle fully engulfs the previous candle’s body.
Understanding these nuances helps traders use the dark cloud cover appropriately.
Practical Example: Spotting the Pattern
Picture this: a stock has been climbing steadily. One day, buyers push it to a new high, but the next day the stock opens even higher—only to fall dramatically and close below the halfway point of the previous day. That’s your dark cloud cover pattern in action.
Have you encountered any charts like this while browsing trading platforms or news? You’re honing your pattern recognition just by paying attention!
Using the Pattern in Trading Strategies
Traders often use the dark cloud cover to:
- Trim bullish positions or set tighter stop losses.
- Signal potential short-selling opportunities.
- Confirm other signs of market weakness.
But like any signal, it’s usually combined with other tools to increase confidence in trade decisions.
Mistakes to Avoid When Using This Pattern
One common pitfall is assuming the pattern guarantees immediate reversal. Markets can be unpredictable, and false signals happen. It’s essential to:
- Confirm the pattern appears after a genuine uptrend.
- Look for volume confirmation.
- Use additional indicators like RSI or moving averages.
Don’t jump the gun — think of this pattern as a warning light, not a command.
Integrating With Other Technical Indicators
For stronger analysis, traders combine the dark cloud cover with indicators such as:
- Relative Strength Index (RSI): To check if the stock is overbought.
- Moving Averages: To confirm trend direction.
- Volume: Increased volume during the pattern adds reliability.
What indicators do you find helpful when analyzing charts?
How Trading Courses Teach Candlestick Patterns
Many trading courses cover candlestick analysis, including the dark cloud cover pattern, helping learners understand visual price action cues. These courses often include:
- Step-by-step video explanations.
- Chart examples.
- Interactive quizzes.
- Practice exercises to identify patterns in real market data.
Taking a course can speed up your learning curve if you prefer structured guidance.
Pros and Cons of Relying on This Pattern
Pros:
- Easy to identify visually.
- Provides early warning of potential reversals.
- Useful for timing entries and exits.
Cons:
- Not 100% reliable — false signals can occur.
- Works best combined with other technical and fundamental analysis.
- Less effective in highly volatile or sideways markets.
Final Thoughts: Should You Trust the Dark Cloud Cover Pattern?
The dark cloud cover candle pattern is a valuable tool in a trader’s toolkit, especially for spotting possible reversals from uptrends. But just like a weather forecast, it’s a prediction, not a certainty. Combining it with other signals and sound risk management is key to making smart trading decisions.
Are you ready to start spotting this pattern on your own charts or in your favorite trading app?
Frequently Asked Questions (FAQs)
Q1: What is the dark cloud cover pattern?
A: It’s a two-candle bearish reversal pattern signaling a potential shift from an uptrend to a downtrend.
Q2: How can I identify a dark cloud cover candle pattern?
A: Look for a bullish candle followed by a bearish candle that opens above the prior close but closes below the midpoint of the prior candle’s body.
Q3: Does the dark cloud cover pattern guarantee a price drop?
A: No, it suggests a possible reversal but should be confirmed with other indicators.
Q4: Are there online trading courses that teach this pattern?
A: Yes, many free and paid courses cover candlestick patterns like dark cloud cover in detail.
Q5: Can the dark cloud cover pattern be used for day trading?
A: Yes, it can be applied across time frames, but effectiveness varies with market conditions.